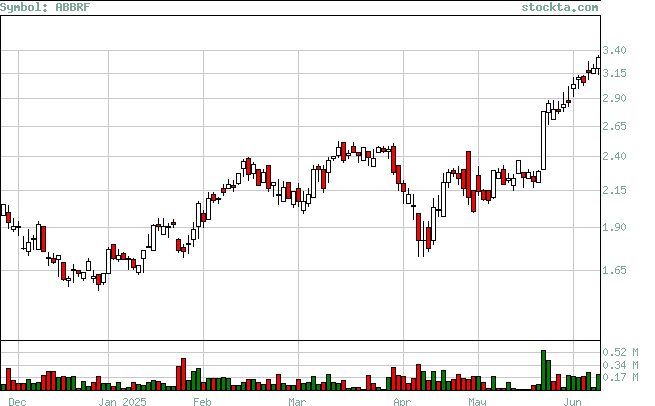
ABBRF Analysis
High Analysis:
Evaluates if the stock is reaching new highs, and if so if there is volume to support the moves.

| High | Volume | Date | Volume Broken | Date Broken |
| 1.8 | 52,945 | Jan-03-2025 | 0 | Not Broken |
| 1.92 | 103,308 | Dec-11-2024 | 0 | Not Broken |
| 2.1 | 196,500 | Nov-18-2024 | 0 | Not Broken |
| 2.49 | 227,100 | Oct-30-2024 | 0 | Not Broken |
| 2.033 | 168,100 | Sept-24-2024 | 84,700 | Oct-10-2024 |
| 1.89 | 106,900 | Aug-23-2024 | 157,000 | Sept-16-2024 |
| 1.87 | 142,700 | Aug-01-2024 | 167,000 | Aug-20-2024 |
| 2.04 | 109,000 | Jul-17-2024 | 84,700 | Oct-10-2024 |