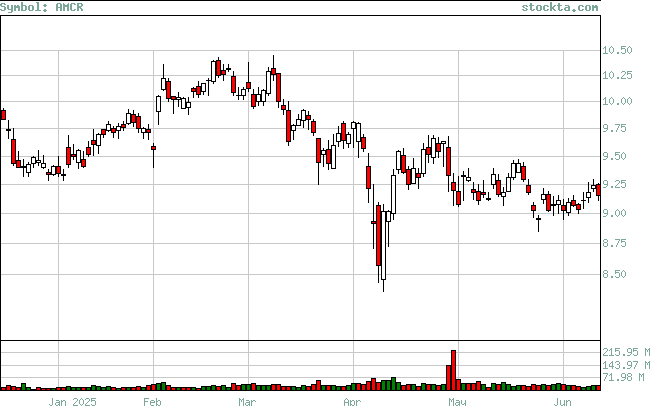
AMCR Analysis
Low Analysis:
Evaluates if the stock is reaching new lows, and if so if there is volume to support the moves.

| Low | Volume | Date | Volume Broken | Date Broken |
| 8.97 | 124,128,375 | Jun-20-2025 | 0 | Not Broken |
| 9.01 | 23,487,214 | Jun-03-2025 | 124,128,375 | Jun-20-2025 |
| 8.95 | 24,950,851 | May-23-2025 | 0 | Not Broken |
| 9.08 | 59,561,300 | May-01-2025 | 30,036,500 | May-22-2025 |
| 8.46 | 51,961,800 | Apr-09-2025 | 0 | Not Broken |
| 9.39 | 27,849,886 | Mar-26-2025 | 48,192,448 | Apr-04-2025 |
| 9.63 | 22,734,170 | Mar-13-2025 | 56,457,224 | Mar-21-2025 |
| 9.96 | 36,169,012 | Mar-04-2025 | 21,600,555 | Mar-12-2025 |
| 9.56 | 34,453,384 | Feb-03-2025 | 56,457,224 | Mar-21-2025 |
