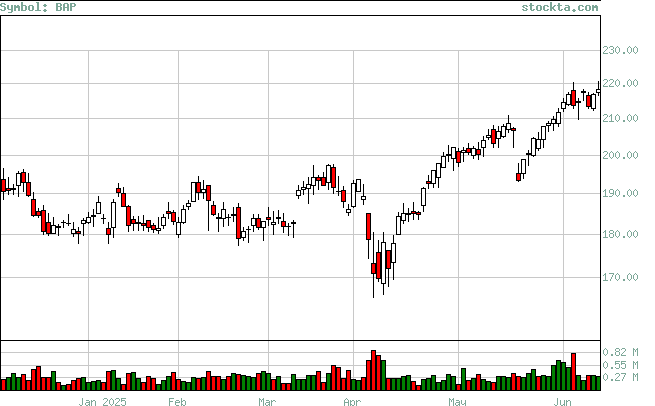
BAP Analysis
High Analysis:
Evaluates if the stock is reaching new highs, and if so if there is volume to support the moves.

| High | Volume | Date | Volume Broken | Date Broken |
| 227.9 | 228,600 | Jul-03-2025 | 0 | Not Broken |
| 208.52 | 275,416 | May-15-2025 | 539,826 | May-29-2025 |
| 202.19 | 292,800 | Apr-30-2025 | 223,868 | May-08-2025 |
| 197.4 | 367,990 | Mar-25-2025 | 164,700 | Apr-25-2025 |
| 184.12 | 350,931 | Mar-03-2025 | 234,934 | Mar-17-2025 |
| 192.96 | 247,138 | Feb-07-2025 | 320,176 | Mar-20-2025 |
| 191.35 | 248,900 | Jan-15-2025 | 274,519 | Feb-06-2025 |
