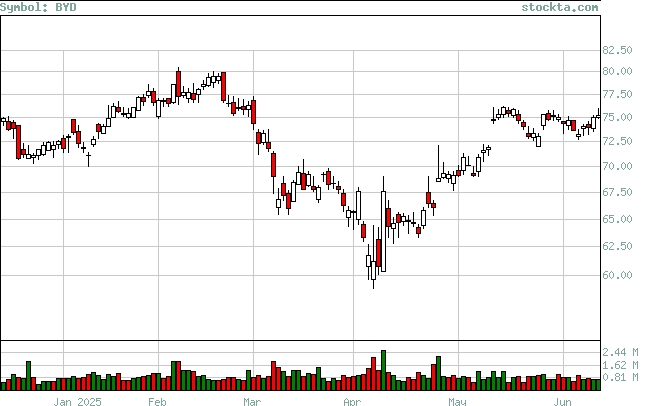
BYD Analysis
High Analysis:
Evaluates if the stock is reaching new highs, and if so if there is volume to support the moves.

| High | Volume | Date | Volume Broken | Date Broken |
| 75.41 | 690,142 | May-28-2025 | 885,300 | Jun-18-2025 |
| 76.08 | 1,173,080 | May-14-2025 | 2,502,150 | Jun-20-2025 |
| 69.5 | 558,229 | Mar-25-2025 | 753,420 | May-01-2025 |
| 76.87 | 818,986 | Mar-03-2025 | 890,300 | Jun-23-2025 |
| 79.93 | 711,677 | Feb-21-2025 | 1,185,600 | Jul-01-2025 |
| 80 | 1,851,991 | Feb-07-2025 | 1,185,600 | Jul-01-2025 |
