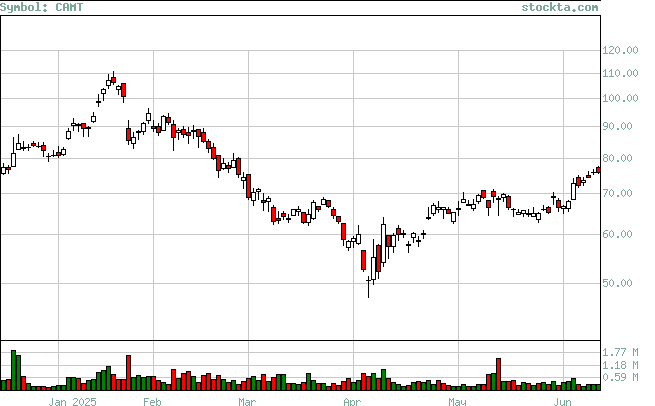
CAMT Analysis
High Analysis:
Evaluates if the stock is reaching new highs, and if so if there is volume to support the moves.

| High | Volume | Date | Volume Broken | Date Broken |
| 84.64 | 1,651,961 | Dec-19-2024 | 0 | Not Broken |
| 79.03 | 475,838 | Dec-10-2024 | 1,890,922 | Dec-18-2024 |
| 86.25 | 773,300 | Nov-13-2024 | 0 | Not Broken |
| 83.63 | 503,200 | Oct-29-2024 | 1,575,300 | Nov-12-2024 |
| 87.61 | 498,100 | Oct-14-2024 | 0 | Not Broken |
| 86.73 | 1,612,100 | Sept-26-2024 | 498,100 | Oct-14-2024 |
| 101.03 | 704,800 | Aug-15-2024 | 0 | Not Broken |
| 139.01 | 540,900 | Jul-09-2024 | 0 | Not Broken |