
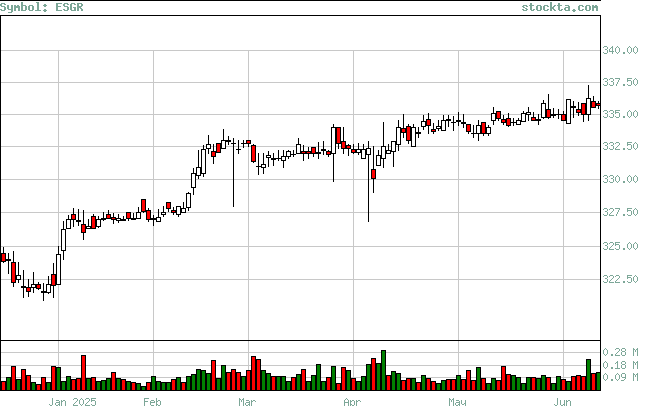
ESGR Analysis
High Analysis:
Evaluates if the stock is reaching new highs, and if so if there is volume to support the moves.
| High | Volume | Date | Volume Broken | Date Broken |
| 336.74 | 167,536 | Jun-20-2025 | 237,945 | Jul-01-2025 |
| 336.24 | 220,936 | Jun-09-2025 | 82,169 | Jun-18-2025 |
| 335.19 | 67,881 | May-13-2025 | 110,006 | May-27-2025 |
| 334.6 | 85,115 | Apr-23-2025 | 86,896 | May-12-2025 |
| 333.99 | 50,960 | Mar-27-2025 | 81,249 | Apr-16-2025 |
| 333.99 | 173,007 | Mar-26-2025 | 50,960 | Mar-27-2025 |
| 332.7 | 112,346 | Mar-17-2025 | 173,007 | Mar-26-2025 |
| 333.03 | 176,973 | Feb-24-2025 | 173,007 | Mar-26-2025 |
| 328.52 | 23,379 | Jan-30-2025 | 96,537 | Feb-12-2025 |
| 327.38 | 80,100 | Jan-07-2025 | 86,900 | Jan-21-2025 |