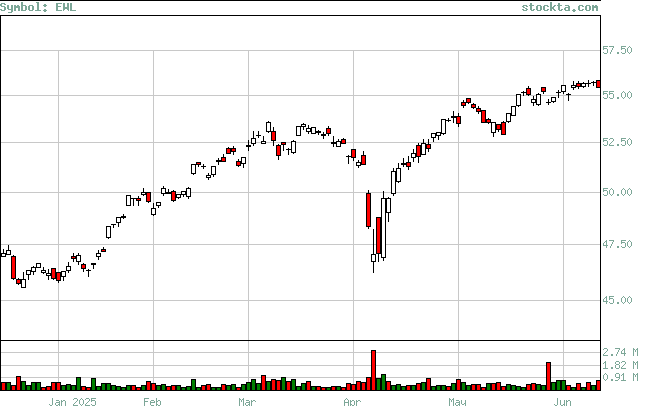
EWL Analysis
Low Analysis:
Evaluates if the stock is reaching new lows, and if so if there is volume to support the moves.

| Low | Volume | Date | Volume Broken | Date Broken |
| 52.68 | 637,223 | Jun-20-2025 | 0 | Not Broken |
| 52.94 | 269,300 | May-14-2025 | 637,223 | Jun-20-2025 |
| 46.72 | 2,918,361 | Apr-07-2025 | 0 | Not Broken |
| 51.87 | 695,788 | Mar-11-2025 | 479,783 | Mar-31-2025 |
| 48.94 | 446,900 | Feb-03-2025 | 904,100 | Apr-04-2025 |
