
GSHD Analysis
High Analysis:
Evaluates if the stock is reaching new highs, and if so if there is volume to support the moves.
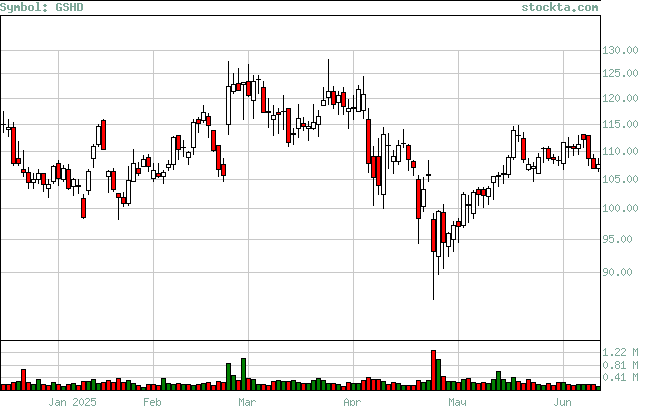
| High | Volume | Date | Volume Broken | Date Broken |
| 105.51 | 315,053 | Jun-30-2025 | 0 | Not Broken |
| 113 | 171,026 | Jun-06-2025 | 0 | Not Broken |
| 113.83 | 406,009 | May-16-2025 | 0 | Not Broken |
| 121.83 | 204,000 | Apr-02-2025 | 0 | Not Broken |
| 123.87 | 187,462 | Mar-05-2025 | 0 | Not Broken |
| 115.64 | 257,711 | Jan-17-2025 | 165,229 | Feb-14-2025 |