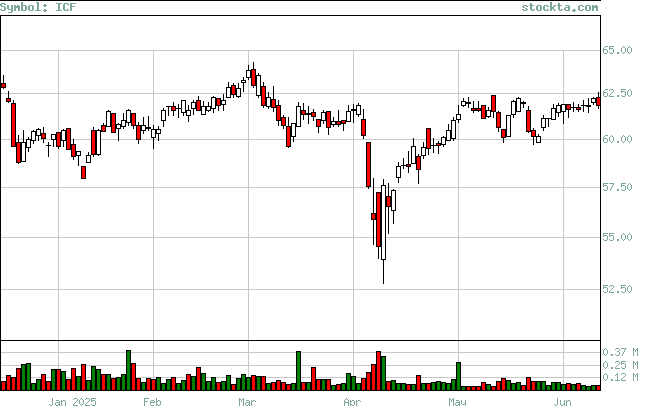
ICF Analysis
High Analysis:
Evaluates if the stock is reaching new highs, and if so if there is volume to support the moves.

| High | Volume | Date | Volume Broken | Date Broken |
| 66.05 | 84,600 | Nov-26-2024 | 0 | Not Broken |
| 64.52 | 120,300 | Nov-08-2024 | 119,100 | Nov-21-2024 |
| 66.01 | 67,400 | Oct-25-2024 | 84,600 | Nov-26-2024 |
| 65.98 | 238,600 | Oct-16-2024 | 67,400 | Oct-25-2024 |
| 67.37 | 95,500 | Sept-16-2024 | 0 | Not Broken |
| 61.93 | 89,100 | Aug-02-2024 | 59,750 | Aug-09-2024 |
| 60.88 | 105,800 | Jul-17-2024 | 115,400 | Jul-31-2024 |