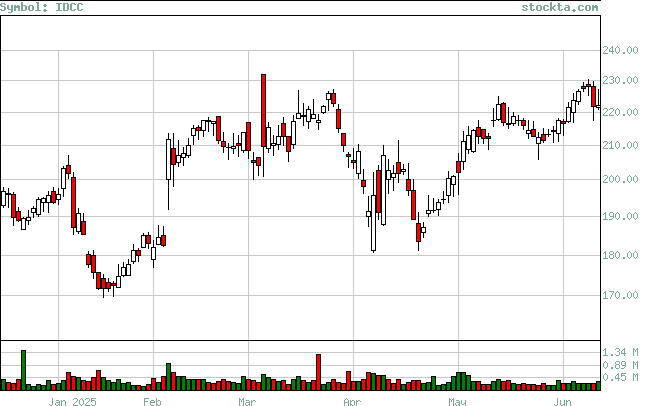
IDCC Analysis
High Analysis:
Evaluates if the stock is reaching new highs, and if so if there is volume to support the moves.

| High | Volume | Date | Volume Broken | Date Broken |
| 235.56 | 225,317 | Jun-25-2025 | 0 | Not Broken |
| 228.81 | 244,995 | Jun-09-2025 | 230,345 | Jun-23-2025 |
| 222.75 | 286,199 | May-14-2025 | 298,649 | Jun-04-2025 |
| 225.72 | 362,659 | Mar-26-2025 | 223,065 | Jun-05-2025 |
| 225.72 | 258,728 | Mar-25-2025 | 362,659 | Mar-26-2025 |
| 231.965 | 544,918 | Mar-06-2025 | 230,345 | Jun-23-2025 |
| 218.76 | 306,359 | Feb-21-2025 | 544,918 | Mar-06-2025 |
