
IYT Analysis
High Analysis:
Evaluates if the stock is reaching new highs, and if so if there is volume to support the moves.
| High | Volume | Date | Volume Broken | Date Broken |
| 68.075 | 606,995 | Jun-11-2025 | 517,926 | Jun-27-2025 |
| 68.41 | 151,500 | May-16-2025 | 517,926 | Jun-27-2025 |
| 61.305 | 468,337 | Apr-23-2025 | 628,608 | May-02-2025 |
| 66.41 | 314,396 | Mar-25-2025 | 2,899,983 | May-12-2025 |
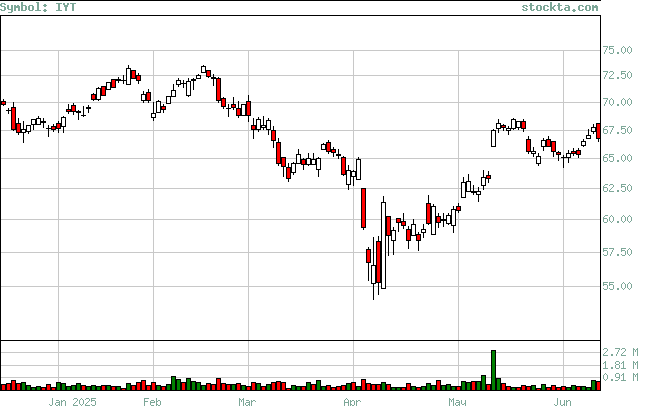
| 73.39 | 321,000 | Feb-18-2025 | 0 | Not Broken |
| 73.22 | 495,665 | Jan-27-2025 | 321,000 | Feb-18-2025 |