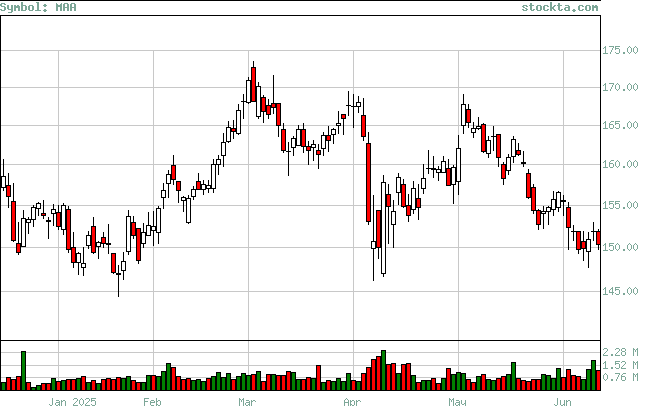
MAA Analysis
High Analysis:
Evaluates if the stock is reaching new highs, and if so if there is volume to support the moves.

| High | Volume | Date | Volume Broken | Date Broken |
| 165.51 | 108,479 | Nov-27-2024 | 0 | Not Broken |
| 161.34 | 663,100 | Nov-13-2024 | 1,044,500 | Nov-25-2024 |
| 156.64 | 486,700 | Oct-24-2024 | 1,144,900 | Nov-06-2024 |
| 167.12 | 552,600 | Sept-16-2024 | 0 | Not Broken |
| 154.65 | 678,700 | Aug-12-2024 | 858,100 | Aug-23-2024 |
| 144.73 | 577,800 | Jul-23-2024 | 835,300 | Aug-01-2024 |