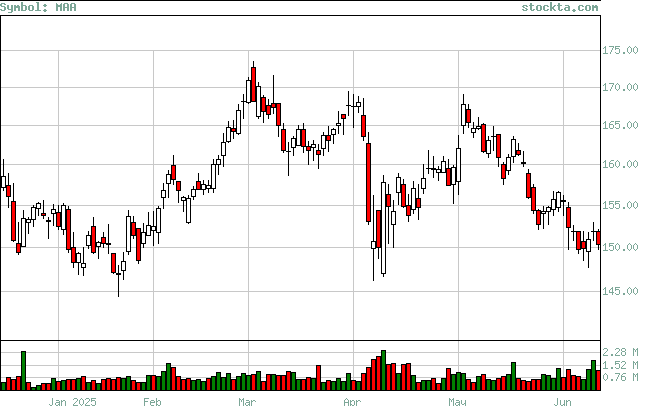
MAA Analysis
Low Analysis:
Evaluates if the stock is reaching new lows, and if so if there is volume to support the moves.

| Low | Volume | Date | Volume Broken | Date Broken |
| 145.91 | 1,387,000 | Jun-25-2025 | 0 | Not Broken |
| 152.76 | 659,300 | May-23-2025 | 1,252,776 | Jun-03-2025 |
| 146.98 | 2,432,504 | Apr-09-2025 | 1,387,000 | Jun-25-2025 |
| 161.27 | 1,471,654 | Mar-21-2025 | 1,386,167 | Apr-04-2025 |
| 161.7 | 1,147,682 | Mar-13-2025 | 1,471,654 | Mar-21-2025 |
| 153.01 | 691,854 | Feb-12-2025 | 1,854,618 | Apr-07-2025 |
