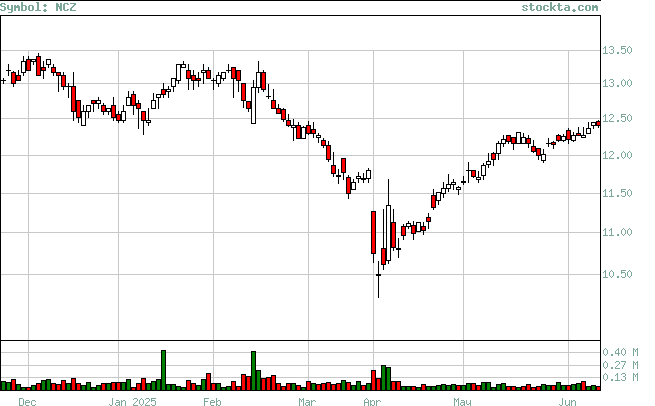
NCZ Analysis
Low Analysis:
Evaluates if the stock is reaching new lows, and if so if there is volume to support the moves.

| Low | Volume | Date | Volume Broken | Date Broken |
| 3.12 | 311,199 | Jan-02-2025 | 302,285 | Jan-03-2025 |
| 3.1 | 172,606 | Dec-20-2024 | 0 | Not Broken |
| 3.07 | 195,700 | Nov-15-2024 | 0 | Not Broken |
| 2.99 | 458,200 | Nov-04-2024 | 0 | Not Broken |
| 2.99 | 517,100 | Nov-01-2024 | 458,200 | Nov-04-2024 |
| 3.07 | 599,500 | Oct-04-2024 | 997,800 | Oct-25-2024 |
| 3.07 | 239,200 | Oct-03-2024 | 599,500 | Oct-04-2024 |
| 3.07 | 404,100 | Oct-02-2024 | 239,200 | Oct-03-2024 |
| 2.97 | 606,700 | Sept-09-2024 | 0 | Not Broken |
| 2.97 | 312,700 | Sept-06-2024 | 606,700 | Sept-09-2024 |
| 2.97 | 550,600 | Sept-05-2024 | 312,700 | Sept-06-2024 |
| 2.89 | 1,199,900 | Aug-16-2024 | 0 | Not Broken |
| 2.8299 | 771,800 | Aug-05-2024 | 0 | Not Broken |