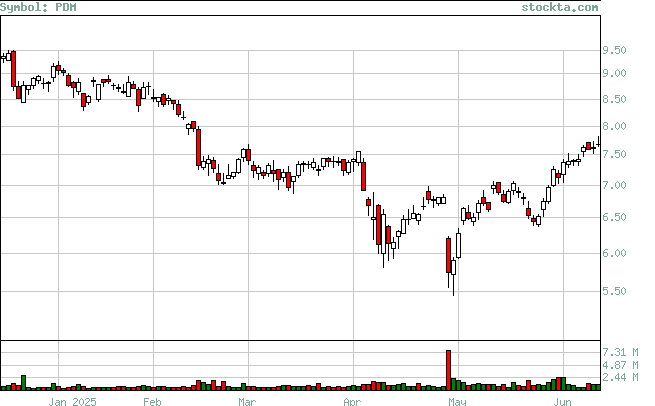
PDM Analysis
High Analysis:
Evaluates if the stock is reaching new highs, and if so if there is volume to support the moves.

| High | Volume | Date | Volume Broken | Date Broken |
| 9.18 | 598,181 | Jan-02-2025 | 0 | Not Broken |
| 9.46 | 1,326,664 | Dec-18-2024 | 0 | Not Broken |
| 9.9 | 549,601 | Nov-27-2024 | 0 | Not Broken |
| 10.67 | 1,529,600 | Nov-06-2024 | 0 | Not Broken |
| 11.07 | 531,600 | Oct-18-2024 | 0 | Not Broken |
| 10.25 | 614,500 | Sept-26-2024 | 477,900 | Oct-14-2024 |
| 9.76 | 776,700 | Aug-30-2024 | 739,100 | Sept-13-2024 |
| 8.77 | 583,500 | Jul-29-2024 | 767,800 | Aug-13-2024 |