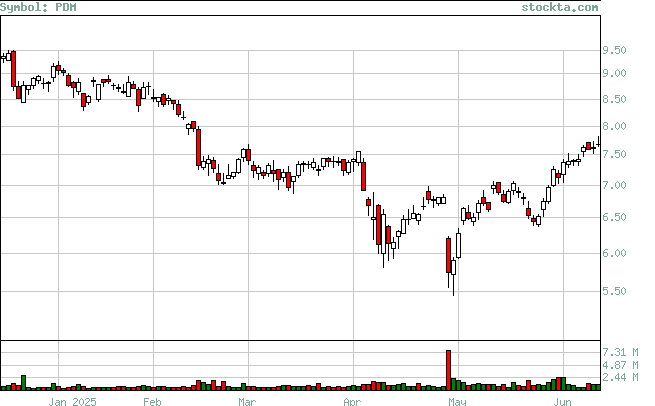
PDM Analysis
Low Analysis:
Evaluates if the stock is reaching new lows, and if so if there is volume to support the moves.

| Low | Volume | Date | Volume Broken | Date Broken |
| 7.1 | 1,239,900 | Jun-25-2025 | 0 | Not Broken |
| 7.2 | 905,900 | Jun-13-2025 | 1,239,900 | Jun-25-2025 |
| 6.4 | 1,040,500 | May-23-2025 | 0 | Not Broken |
| 5.72 | 2,215,100 | Apr-30-2025 | 0 | Not Broken |
| 6 | 1,415,000 | Apr-09-2025 | 7,796,500 | Apr-29-2025 |
| 6.97 | 915,474 | Mar-13-2025 | 981,700 | Apr-03-2025 |
| 7.02 | 1,641,074 | Feb-24-2025 | 915,474 | Mar-13-2025 |
| 8.38 | 625,422 | Jan-29-2025 | 562,515 | Feb-10-2025 |
