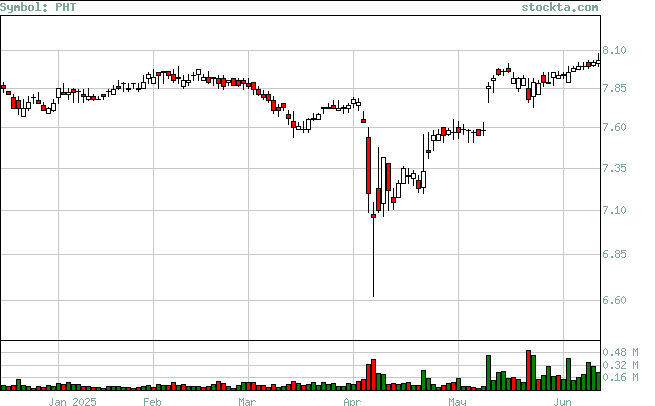
PHT Analysis
High Analysis:
Evaluates if the stock is reaching new highs, and if so if there is volume to support the moves.

| High | Volume | Date | Volume Broken | Date Broken |
| 7.85 | 84,251 | Jan-02-2025 | 0 | Not Broken |
| 7.98 | 50,849 | Dec-11-2024 | 0 | Not Broken |
| 7.99 | 72,300 | Nov-11-2024 | 0 | Not Broken |
| 8.04 | 70,300 | Oct-14-2024 | 0 | Not Broken |
| 8 | 113,300 | Sept-30-2024 | 85,900 | Oct-09-2024 |
| 8.03 | 92,600 | Sept-19-2024 | 45,700 | Oct-10-2024 |
| 7.91 | 51,100 | Sept-05-2024 | 58,800 | Sept-13-2024 |
| 7.76 | 100,500 | Aug-02-2024 | 80,323 | Aug-23-2024 |
| 7.76 | 48,100 | Aug-01-2024 | 100,500 | Aug-02-2024 |
| 7.71 | 64,929 | Jul-18-2024 | 62,776 | Jul-31-2024 |