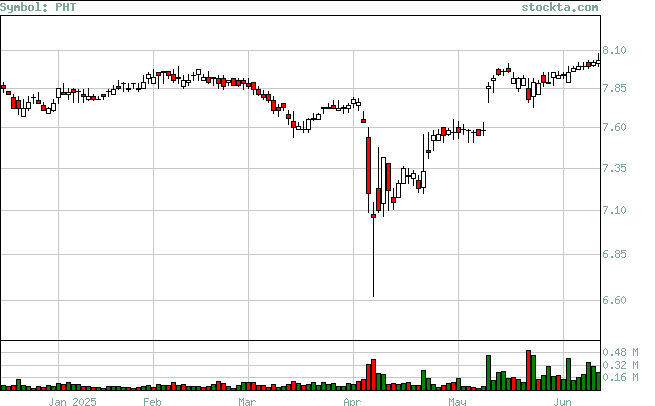
PHT Analysis
Low Analysis:
Evaluates if the stock is reaching new lows, and if so if there is volume to support the moves.

| Low | Volume | Date | Volume Broken | Date Broken |
| 7.96 | 190,197 | Jun-24-2025 | 0 | Not Broken |
| 7.96 | 453,128 | Jun-23-2025 | 190,197 | Jun-24-2025 |
| 7.78 | 508,489 | May-21-2025 | 0 | Not Broken |
| 7.55 | 24,806 | May-07-2025 | 0 | Not Broken |
| 7.06 | 383,800 | Apr-07-2025 | 0 | Not Broken |
| 7.59 | 73,452 | Mar-19-2025 | 328,000 | Apr-04-2025 |
| 7.59 | 53,280 | Mar-18-2025 | 73,452 | Mar-19-2025 |
| 7.59 | 77,339 | Mar-17-2025 | 53,280 | Mar-18-2025 |
| 7.86 | 80,961 | Feb-24-2025 | 98,882 | Mar-03-2025 |
| 7.86 | 67,570 | Feb-11-2025 | 80,961 | Feb-24-2025 |
