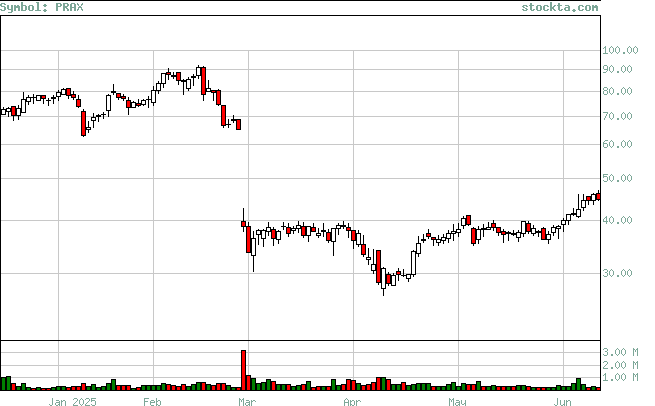
PRAX Analysis
High Analysis:
Evaluates if the stock is reaching new highs, and if so if there is volume to support the moves.

| High | Volume | Date | Volume Broken | Date Broken |
| 40.89 | 432,000 | May-05-2025 | 0 | Not Broken |
| 38.94 | 414,931 | Mar-28-2025 | 512,748 | May-02-2025 |
| 38.93 | 365,357 | Mar-17-2025 | 414,931 | Mar-28-2025 |
| 90.78 | 572,200 | Feb-18-2025 | 0 | Not Broken |
| 79.83 | 842,422 | Jan-22-2025 | 368,374 | Feb-03-2025 |
| 81.15 | 192,300 | Jan-06-2025 | 347,547 | Feb-04-2025 |
| 79.66 | 990,500 | Nov-26-2024 | 269,568 | Jan-03-2025 |
| 76.57 | 552,500 | Nov-15-2024 | 990,500 | Nov-26-2024 |
