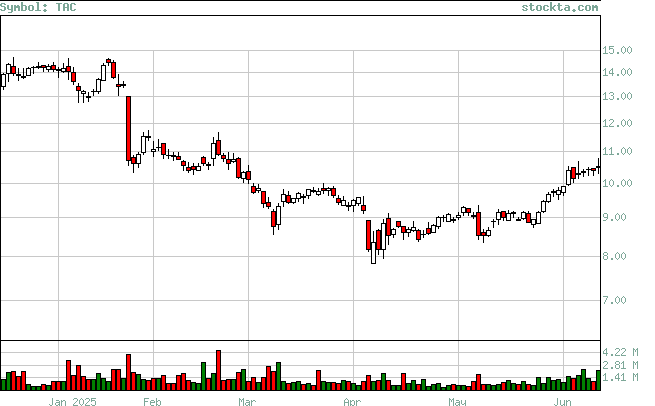
TAC Analysis
High Analysis:
Evaluates if the stock is reaching new highs, and if so if there is volume to support the moves.

| High | Volume | Date | Volume Broken | Date Broken |
| 11.5 | 953,636 | Jun-17-2025 | 902,056 | Jul-14-2025 |
| 9.18 | 890,933 | May-14-2025 | 775,462 | May-27-2025 |
| 9.27 | 547,127 | May-02-2025 | 775,462 | May-27-2025 |
| 9.83 | 804,244 | Mar-26-2025 | 873,824 | Jun-02-2025 |
| 9.83 | 1,001,190 | Mar-24-2025 | 804,244 | Mar-26-2025 |
| 11.39 | 4,499,007 | Feb-21-2025 | 3,275,726 | Jun-12-2025 |
| 14.55 | 1,006,000 | Jan-21-2025 | 0 | Not Broken |
