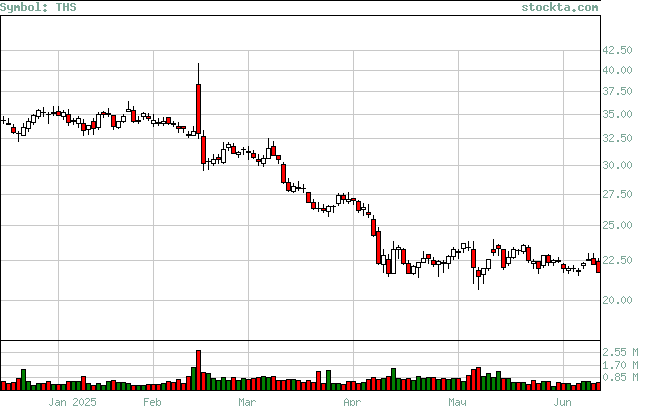
THS Analysis
High Analysis:
Evaluates if the stock is reaching new highs, and if so if there is volume to support the moves.

| High | Volume | Date | Volume Broken | Date Broken |
| 21.2 | 499,400 | Jun-24-2025 | 0 | Not Broken |
| 22.69 | 430,132 | Jun-10-2025 | 0 | Not Broken |
| 23.58 | 509,256 | May-20-2025 | 0 | Not Broken |
| 23.72 | 585,100 | May-02-2025 | 0 | Not Broken |
| 27.4 | 395,689 | Mar-28-2025 | 0 | Not Broken |
| 31.76 | 923,651 | Mar-10-2025 | 0 | Not Broken |
| 38.33 | 2,724,803 | Feb-14-2025 | 0 | Not Broken |
| 35.54 | 453,919 | Jan-27-2025 | 2,724,803 | Feb-14-2025 |
