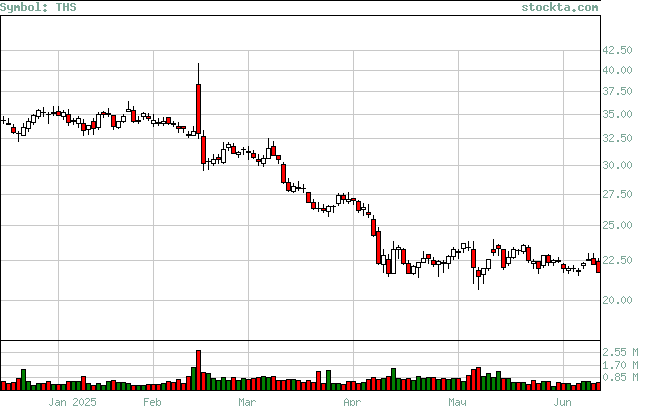
THS Analysis
Low Analysis:
Evaluates if the stock is reaching new lows, and if so if there is volume to support the moves.

| Low | Volume | Date | Volume Broken | Date Broken |
| 19.42 | 564,900 | Jun-30-2025 | 0 | Not Broken |
| 21.98 | 431,664 | May-23-2025 | 454,800 | Jun-03-2025 |
| 21.47 | 1,527,600 | May-07-2025 | 438,700 | Jun-13-2025 |
| 21.65 | 949,916 | Apr-10-2025 | 1,527,600 | May-07-2025 |
| 26.11 | 1,296,225 | Mar-25-2025 | 739,635 | Apr-04-2025 |
| 30.15 | 791,398 | Feb-20-2025 | 674,379 | Mar-12-2025 |
| 30.15 | 1,192,900 | Feb-18-2025 | 791,398 | Feb-20-2025 |
